- Bienvenidos a Persianas Fron
- En que podemos ayudarlo? 15-5180-5059 / 15-4048-3691
- Zona de Cobertura
- Capital Federal
- Bs.As.Zona Norte
- Envienos un email
- info@persianasfron.com.ar
- Horario
- Lunes-Viernes:8.00 a 18.00
- Sábados:8.00 a 12.00
Nosotros
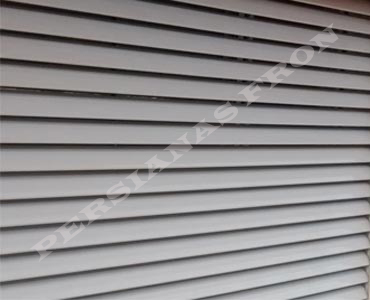
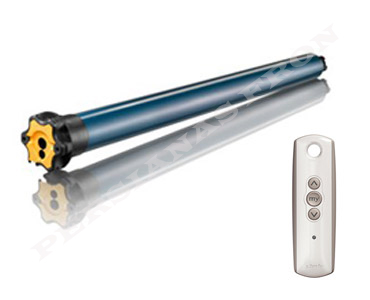
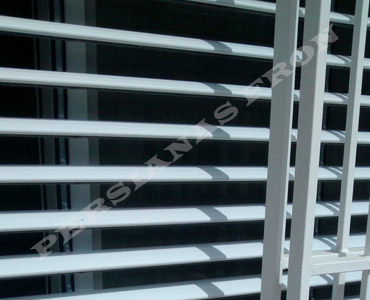
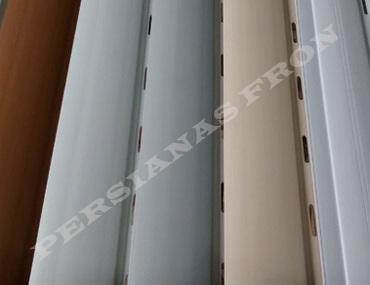
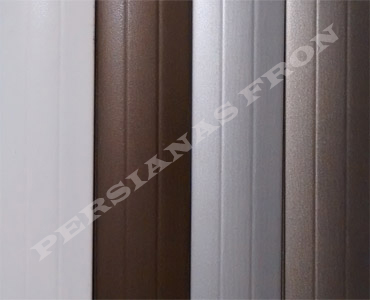
Brindamos asesoramiento integral sobre modelos, calidades, instalación y mantenimiento de persianas, tanto para el hogar como para la construcción.
Realizamos todos nuestros trabajos con el mayor grado de compromiso y responsabilidad, ofreciendo a nuestros clientes un excelente servicio y calidad en los productos.
Nuestros Productos y Servicios
Presupuestos sin cargo
Tiene una pregunta, no dude en consultarnos.Escríbanos: info@persianasfron.com.arLlámenos:(011)4755-8860 (011)4753-4189 (011) 15-5180-5059 (011)15-4048-3691.